Test: 74 79 64 58 63 56 60 75 64
SAT: 570 563 520 336 447 329 459 637 470
Test: 83 69 74 79 61 63 75 66
SAT: 570 558 457 516 353 487 404 438
- Why would we care about the correlation between performance and the SAT? Answer
- Plot the variables individually and then draw a straight line through the points.Answer
- Calculate the correlation and the regression line, predicting SAT scores from test scores. Answer
- Interpret the correlation coefficient and tell what this suggests about the experiment. Answer
- Interpret the slope and intercept appropriately. Answer
When Katz et al. (1990) looked at students who had not read the passage before taking the test, they found a correlation of .51 for 28 students. Thus the correlation was .697 for the those who read the passage and .51 for those who did not. From the table in the back of the text, the corresponding Fisher transformed values are .858 and .670.
- How would you compare those two correlations? Answer
- Compare the two correlations and interpret your results. Answer
- What, if anything, does it mean to have a difference between the two groups on the mean comprehension score as far as correlation and regression are concerned? Answer
- Write up the results of this experiment as if these were your data and you were submitting the results for publication. Include in this discussion something to indicate that you understand the interpretation of r2. Answer
Answers
1. We would expect that if this test measures the same kinds of skills that are tapped by the SAT, then those who do well on the SAT should also do well on this test, and those who do poorly on the SAT should do poorly on this test. Return
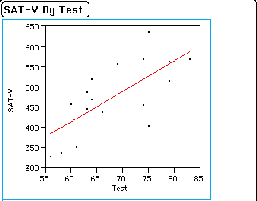
2. The scatter diagram and the regression results from JMP are given in the following image.
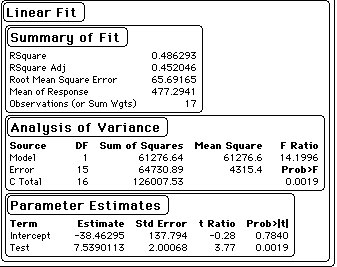
3. The regression results of JMP appear as an image below.
4. The printout shows r-squared = .486, which converts to an r of .697, which, if significant, reflects a high degree of correlation between test performance and SAT scores. From the analysis of variance summary table we can see that an F test on the null hypothesis: ρ = 0, yields an F = 14.20, with an associated probability of p = .0019. Thus we would conclude that a correlation this large or larger would occur with a probability of .0019 if the true value of rho = 0. We will reject the null hypothesis and conclude that there is a significant relationship between SAT scores and test performance. The test scores for those who have read the passage are clearly related to SAT performance on an independent exam. Examinee performance does vary systematically with performance when the passages are present. Return
5. From the printout shown above, we can see an intercept of a = -38.463 and a slope of b = 7.539. this leads to the regression equation
Ŷ = 7.539*Test - 38.463
The table presents t tests for each coefficient. The t for the intercept is -0.28, which is clearly not significant. The t for the slope is 3.77, which has a probability = .0019. This is the same probability associated with the F test on the cohatrrelation, as it should be.
The test on the intercept tells us that there is not sufficient data for us to conclude that the intercept (in the population) is not 0.00. This might at first seem reasonable, since a 0 on one test should go with a 0 on the other. But we know that SATs have a lower limit of 200, meaning that the smallest possible value to associate with a test score of 0 should be 200. There is some curvilinearity in the relationship, such that the line levels off and bottoms out at 200 when the test score = 0. The failure of the intercept to depart significantly from 0 would suggest that our data are not sufficiently robust to detect this leveling off. But since the lowest test score is nowhere near (it is 56), we are extrapolating well beyond the available range of values.
The slope was 7.539 and was significant. A literal interpretation of this slope means that for a one unit difference between two subjects on their test scores, we would expect a 7.539 difference in their SAT scores. Thus a difference between test scores of 80 and 90 should be associated with about a 75 point difference on SATs. The actual predictions for these two values are 565 and 640, respectively. Return
1. The two correlations can be compared using Fisher's r' transformation, the formula for which is given by the following formula.
![]()
The z test on the correlations produces a value of .56. This value does not even approach the critical value of z = |1.96|, we cannot reject the null hypothesis that the two population correlations coefficients are different. Apparently the relationship between test scores and SAT scores holds whether or not the students have read the passage. Return
3. The fact that the groups differed with respect to their means has nothing to say about what the correlations and regression coefficients will look like. It is very likely that those students who have read the passage will do better than those who have not, but that does not mean that within each group those who do best on the test will do best on the SATs, and those who do worst on the test will do worst on the SATs. We could have exactly the same regression line and fit of the points for each group, but with the Passage group's points being displaced left or right relative to those in the NoPassage group. Return
4. In an effort to examine the relationship between reading comprehension and the Scholastic Aptitude Test, two groups of college students were administered sections of old SAT examines with or without seeing the passages to which the questions referred. Although the group that saw the passages performed better than those who did not see the passages, as expected, the NoPassage group still performed better than chance.
To assess the relationship between test scores and prior SAT performance, the correlation between the two measures was computed for those students who read the passage. This correlation was .697, which was significant, revealing a strong relationship between the two measures. Interesting, the correlation for the NoPassage group was not significantly lower (r = .51). The fact that performance in the absence of the passages is still significantly related to SAT performance, suggests that some, if not much, of what the SAT is measuring is independent of the individual's ability to obtain facts from prose and draw appropriate conclusions. There were no facts to be obtained because there was no prose.
These results would suggest that basic test-taking skills, separate from any reading comprehension skills, play an important role in SAT performance. It is very likely that such test-taking skills go along with general reading comprehension, but to measure those skills is not the same as measuring reading comprehension. Return
References
Katz,S., Lautenschlager, G.J., Blackburn, A. B., & Harris, F. H. (1990) Answering reading comprehension items without passages on the SAT. Psychological Science, 1, 122-127. Return
Freedle, R. & Kostin, I. (1994) Can multiple-choice reading tests be construct-valid? Psychological Science, 5, 107-110. Return
![]()
![]()
 Return to
Dave Howell's Statistical Home Page
Last revised: 3/6/2009


